
Author: Kevin, BlockBooster Researcher
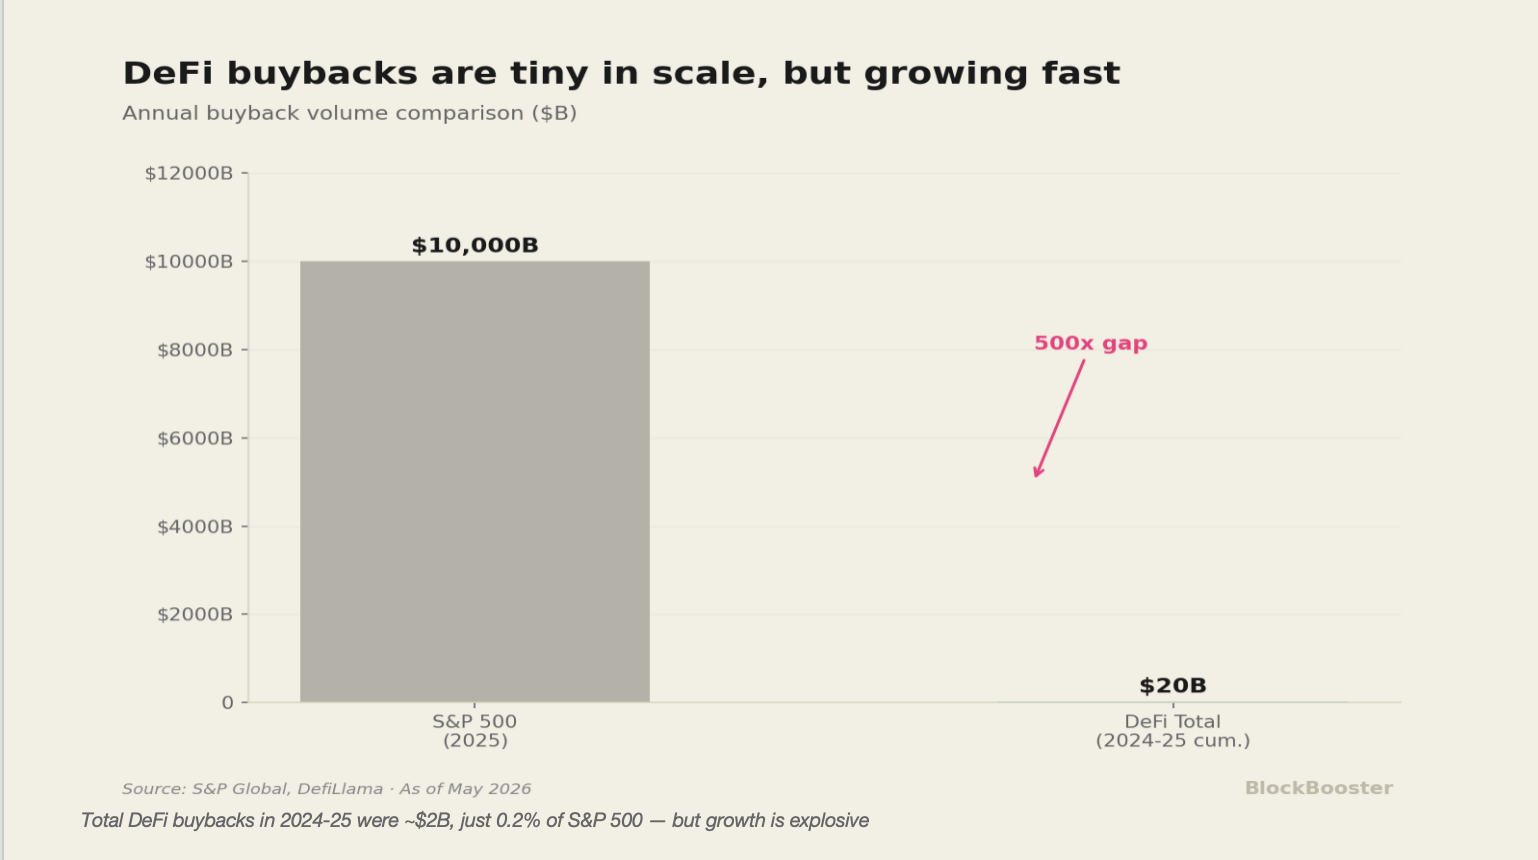
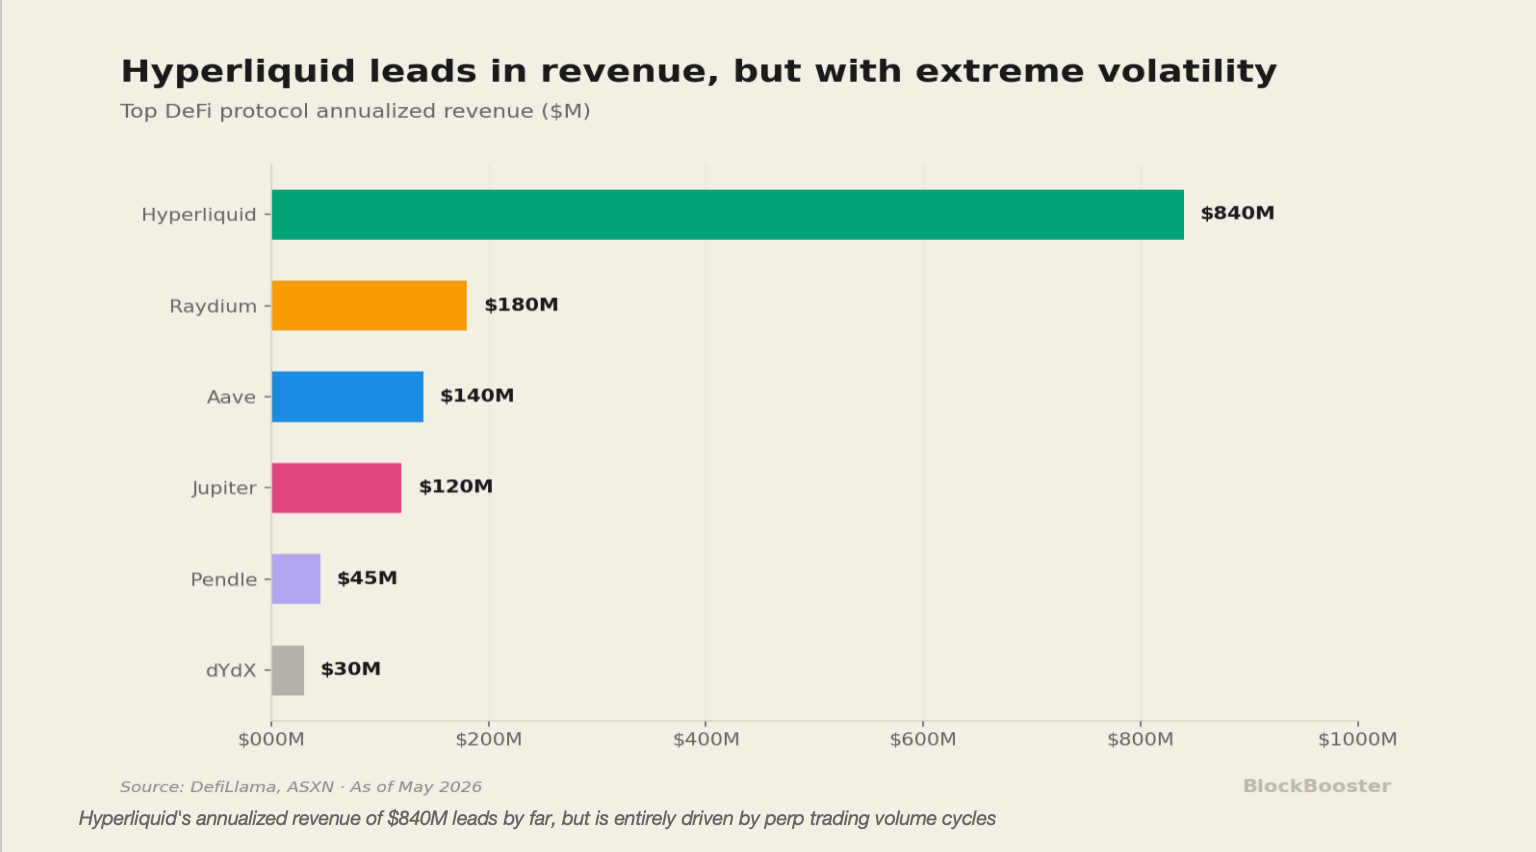
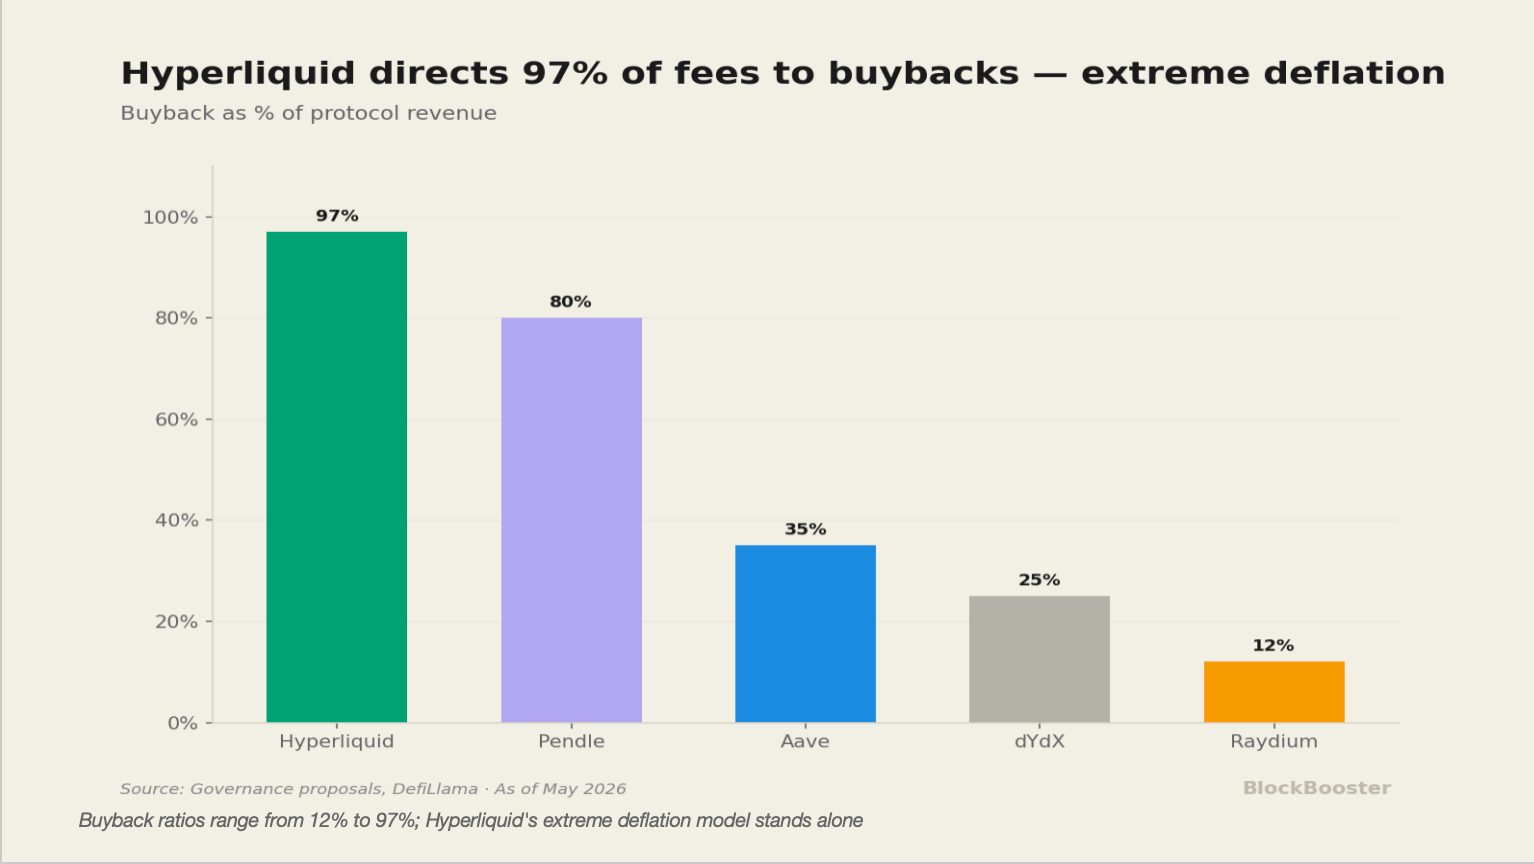
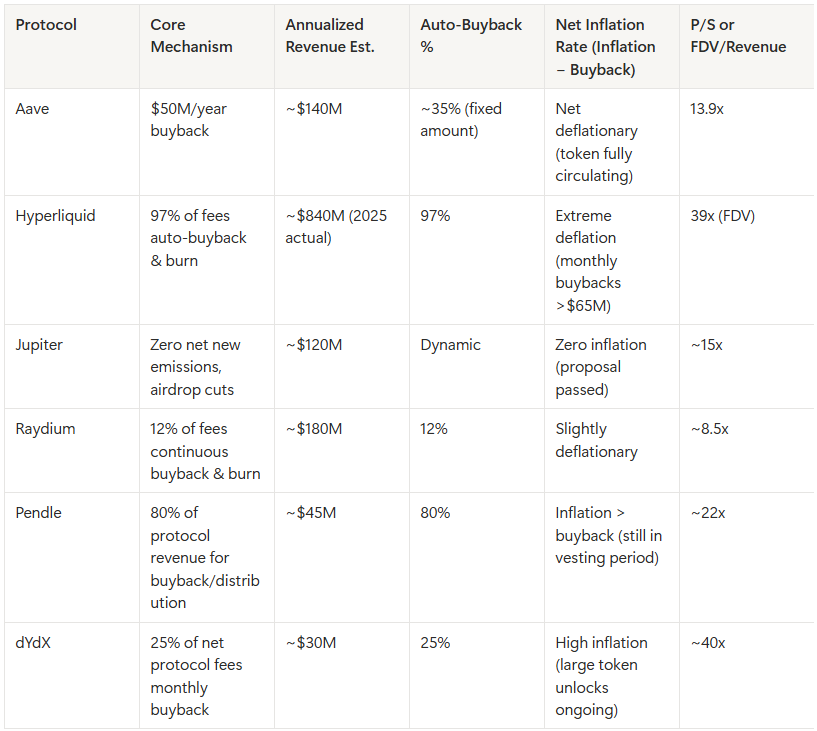
Leading DeFi protocols are collectively transitioning from pure “governance tokens” to “cash flow assets.” Aave passed what its founder called the most important proposal in its history — redirecting 100% of protocol revenue to the DAO and establishing a $50M annual buyback program. Hyperliquid automatically channels 97% of trading fees into HYPE buybacks, accumulating over $1 billion. Jito, Jupiter, Raydium, and Pendle are following suit.
Meanwhile, Bitwise, Grayscale, and 21Shares simultaneously filed ETF applications for HYPE. The approaching ETF approvals are forcing traditional institutions to classify these DeFi assets, creating urgent demand for traditional valuation frameworks — P/E ratios, DCF models — to adapt. How do you price an on-chain asset that is neither a stock nor a bond, lacks any legal residual claim on assets, yet generates real cash flows?
1. The Governance Fractures Triggered by the Fee Switch
1.1 “Aave Will Win”: A Proposal That Tore the Community Apart
On April 12, 2026, the Aave community finally passed a landmark governance proposal known as “Aave Will Win” (AIP-469), ending months of debate over who controls protocol revenue. Its core provisions operated on three levels.
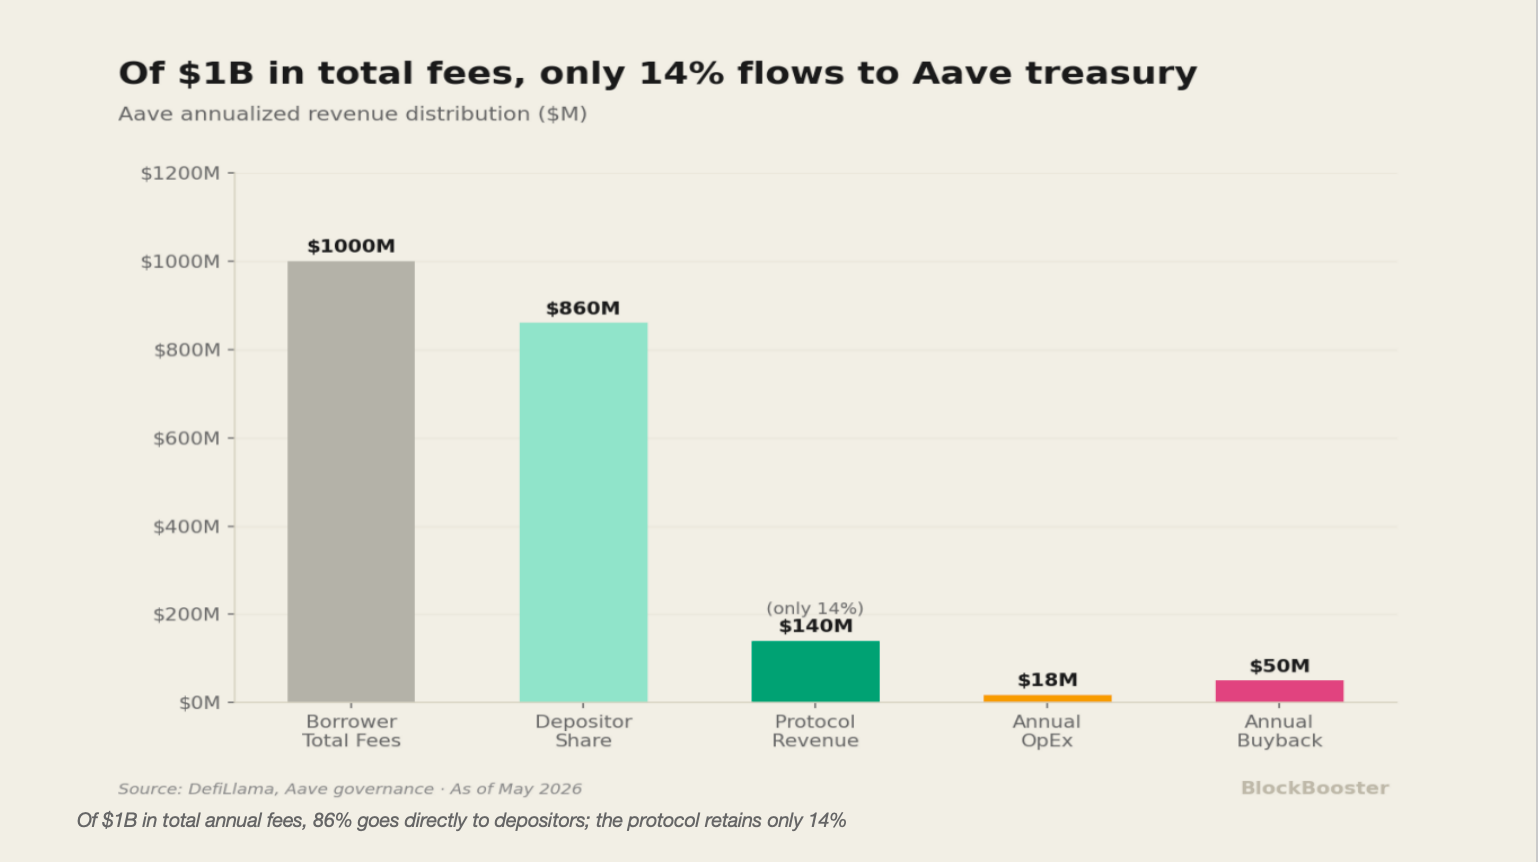
First, full-stack revenue to the DAO. Aave’s ecosystem processed nearly $1 billion in total fees (interest paid by borrowers) in 2025, but the vast majority flows directly to depositors. Only about $140 million — roughly 14% — actually reaches the protocol treasury. “Full-stack revenue to the DAO” means this $140M is no longer retained by the development team but belongs entirely to token holders.
Second, a permanent buyback program. The DAO approved a $50M annual AAVE token buyback plan, co-managed by the Aave Finance Committee and TokenLogic, executed at a flexible weekly rate of $250K to .
Third, a redefined role for the development team. Aave Labs no longer retains protocol revenue directly, instead receiving funding through DAO grants. The passed AIP-469 approved approximately $25M in stablecoins and 75,000 AAVE tokens for Aave Labs (valued at roughly $8.4–9M at the then-prevailing price of $112–120, vesting linearly over 48 months), totaling roughly $33–34M in support. This structural change ignited the community’s most intense governance conflict.
1.2 The Eruption of Governance Contradictions
When protocol revenue is prioritized for token holders, where do the resources required to keep the system running actually come from?
The most serious fractures appeared at the service provider level. Just six days before the final proposal passed (April 6, 2026), Chaos Labs — Aave’s core risk management partner of three years — announced its departure from the ecosystem. The reasons given were telling: “fundamental disagreements on risk strategy,” the growing complexity of the V4 upgrade, and the fact that existing funding could no longer cover its minimum annual operating costs of . Prior to this, BGD Labs, the core V3 development team, had already announced its own departure in February.
Chaos Labs cited $8M in annual operating costs as the reason for leaving — while the DAO had just approved a $50M annual buyback program. A core service provider managing billions of dollars in risk exposure walked away over a mere $8M funding gap, at the very moment the protocol was committing six times that amount to buy its own tokens on the open market. The risk that buybacks would crowd out operational resources was embedded in the proposal the moment it passed.
2. Who Is Actually Achieving “Net Deflation”?
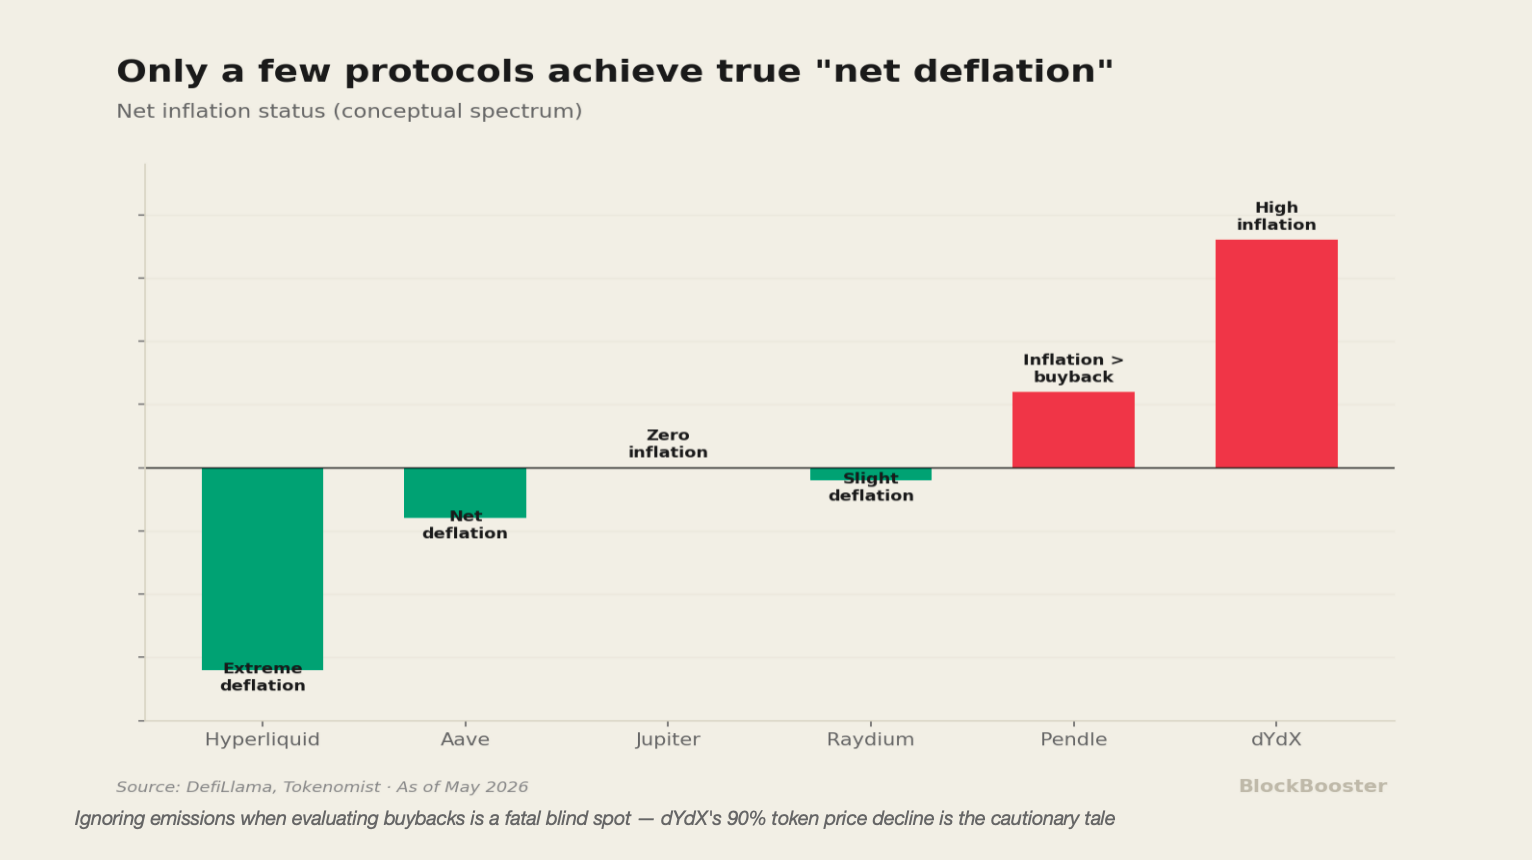
There is a fatal blind spot in evaluating buyback programs: you can never assess buybacks in isolation from token emissions. If a protocol buys back $50M annually but simultaneously emits $100M worth of tokens through liquidity mining or team unlocks, its “real buyback yield” is negative. Only by crossing the net deflation breakeven point can buybacks truly translate into an increase in intrinsic value per token.
2.1 The Core Assessment Framework: Buyback Volume vs. Net New Emissions
Applying this framework, we conducted a cross-protocol comparison of current buyback mechanisms:
2.2 The Overlooked Dimension: Revenue Quality and the NIM Gap
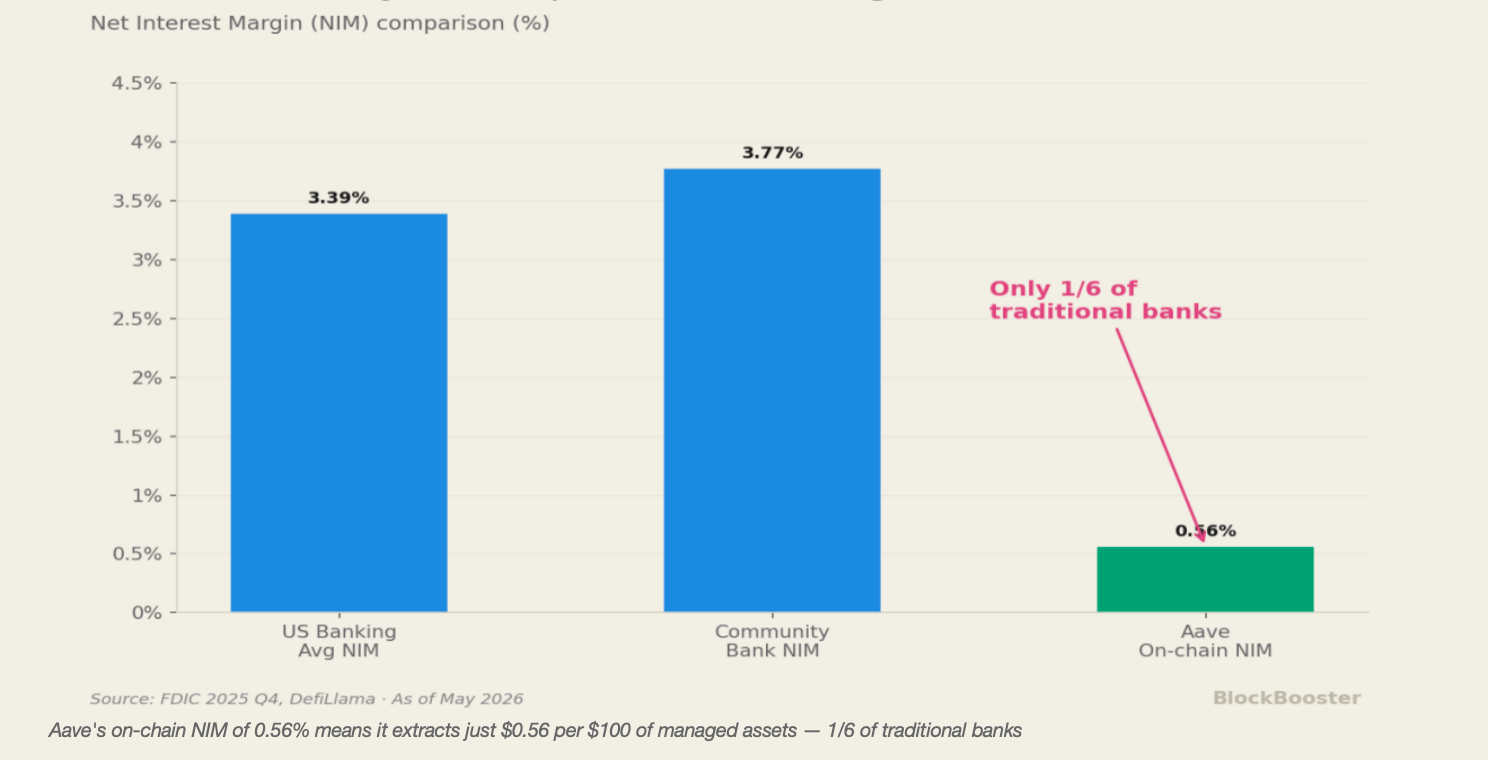
In traditional banking, the core metric for measuring lending profitability is the Net Interest Margin (NIM) — the spread between loan rates and deposit rates. According to the FDIC’s Q4 2025 report, the average US banking NIM stands at 3.39%, the highest since 2019. Community bank NIM reaches 3.77%.
We can construct a comparable “on-chain NIM” metric for Aave: annual protocol revenue divided by average TVL.
-
Aave annualized revenue: ~$140M
-
Aave average TVL: ~$25B
-
Aave “on-chain NIM”: ~0.56%
Aave extracts just $0.56 cents in revenue for every $1 of on-chain assets it manages — just one-sixth of the traditional banking average of 3.39%. And this 0.56% is a gross revenue figure.
Of the nearly $1B in total fees circulating through the Aave ecosystem (total interest paid by borrowers), the vast majority flows directly to depositors; only ~14% ($140M) enters the protocol treasury. By contrast, the US banking industry’s 3.39% NIM is already a net figure.
If measured by Aave’s “net NIM” (net profit after operating costs, divided by TVL), the number would be even lower. DefiLlama records Aave’s annual operating expenses at approximately $18M — but that only captures on-chain traceable costs, excluding external service providers like Chaos Labs.
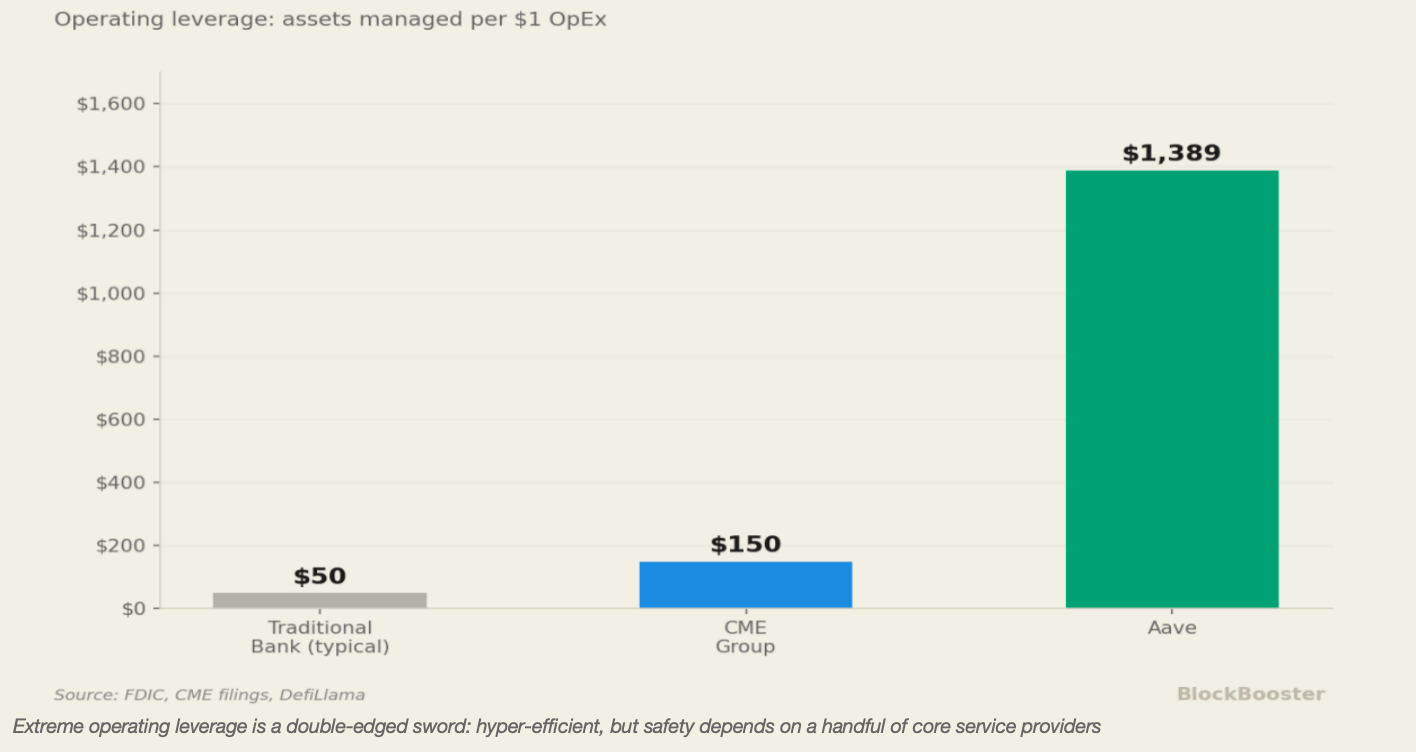
Also worth noting is the difference in operating leverage. Aave manages approximately $25B in TVL with around $18M in annual operating costs — that’s roughly $1,389 in managed assets for every $1 of operating expenditure, an efficiency that traditional banks cannot imagine. But this extreme operating leverage is a double-edged sword: it means the protocol’s security is highly dependent on a very small number of core service providers.
For Aave to generate revenue at the scale of a traditional financial infrastructure company like CME or ICE at its current NIM level, it would need to manage trillions of dollars in TVL — a distant vision at this stage. Yet its current P/S multiple (13.9x) already sits in the same range as CME (15–17x). This raises a sharp question: is the market pricing in an overly optimistic outlook for DeFi protocol growth?
DeFi protocol buybacks are not new — MakerDAO (now Sky) implemented one years ago. So why, in Q2 2026, is the market suddenly scrutinizing buyback data, net inflation rates, and revenue quality under a magnifying glass?
The answer lies in an external catalyst: the pressure being applied by traditional capital markets. As DeFi assets attempt to knock on Wall Street’s door, institutional investors must fit them into existing asset classification systems.
3. Catalysts and Valuation Challenges: ETF Pressure and Pricing Mismatch
3.1 The Catalyst: ETF Applications and Asset Classification Pressure
The urgency around DeFi token valuation reached its peak when traditional asset managers filed ETF applications. In 2026, Bitwise (BHYP, with a designated management fee of 0.67%), Grayscale, and 21Shares all filed spot ETF applications for Hyperliquid’s HYPE token. The designation of fee rates typically signals that a launch is imminent.
ETF applications fundamentally changed the nature of the game. Once a HYPE ETF is approved, fund managers at traditional asset management firms will need to allocate portfolio weights to these assets, set risk parameters, and explain their classification to compliance departments.
ETFs approaching → Institutions need to classify DeFi assets (tech/financials/alternatives) → Urgent need to adapt traditional valuation frameworks (P/E, DCF) → Discovering the limitations of existing frameworks.
Compare this to the already-established BTC and ETH ETFs: BTC is treated as “digital gold” (commodity framework), ETH as a “platform token” (growth stock framework). HYPE/AAVE-type tokens with explicit cash flows require a third framework entirely.
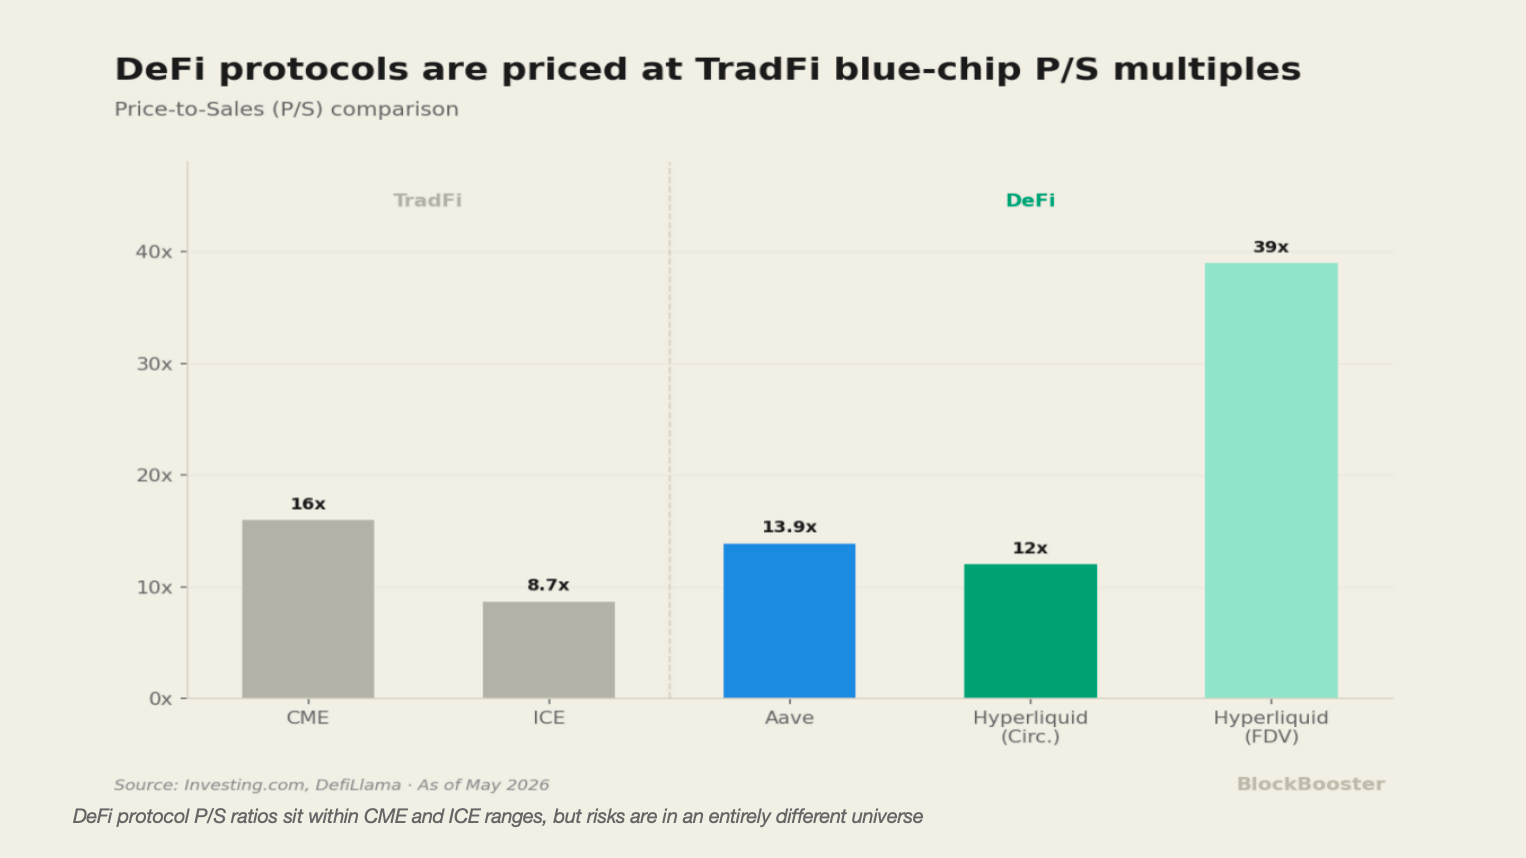
3.2 DeFi Is Already Priced Like TradFi Blue Chips — But the Risks Aren’t in the Same Universe
To illustrate the severity of this contradiction, we directly compare leading DeFi protocols with traditional financial infrastructure companies:
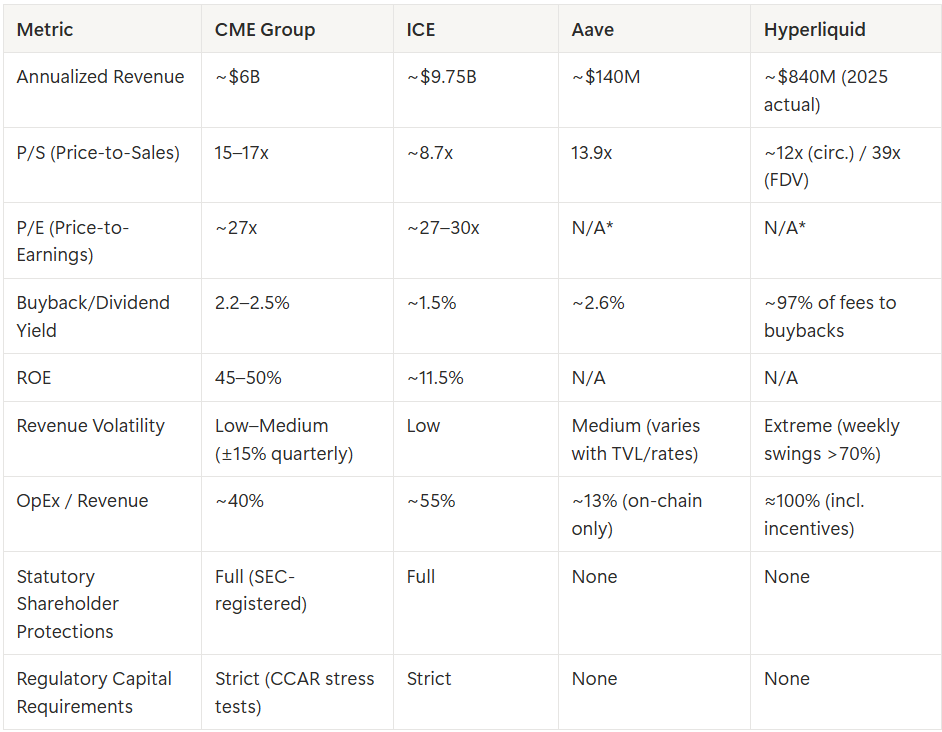
This table reveals a multi-dimensional pricing mismatch.
On the surface, Aave’s P/S of 13.9x falls between CME (15–17x) and ICE (8.7x), seemingly “fairly valued.” But a deeper comparison reveals that this surface-level reasonableness masks four missing risk discounts:
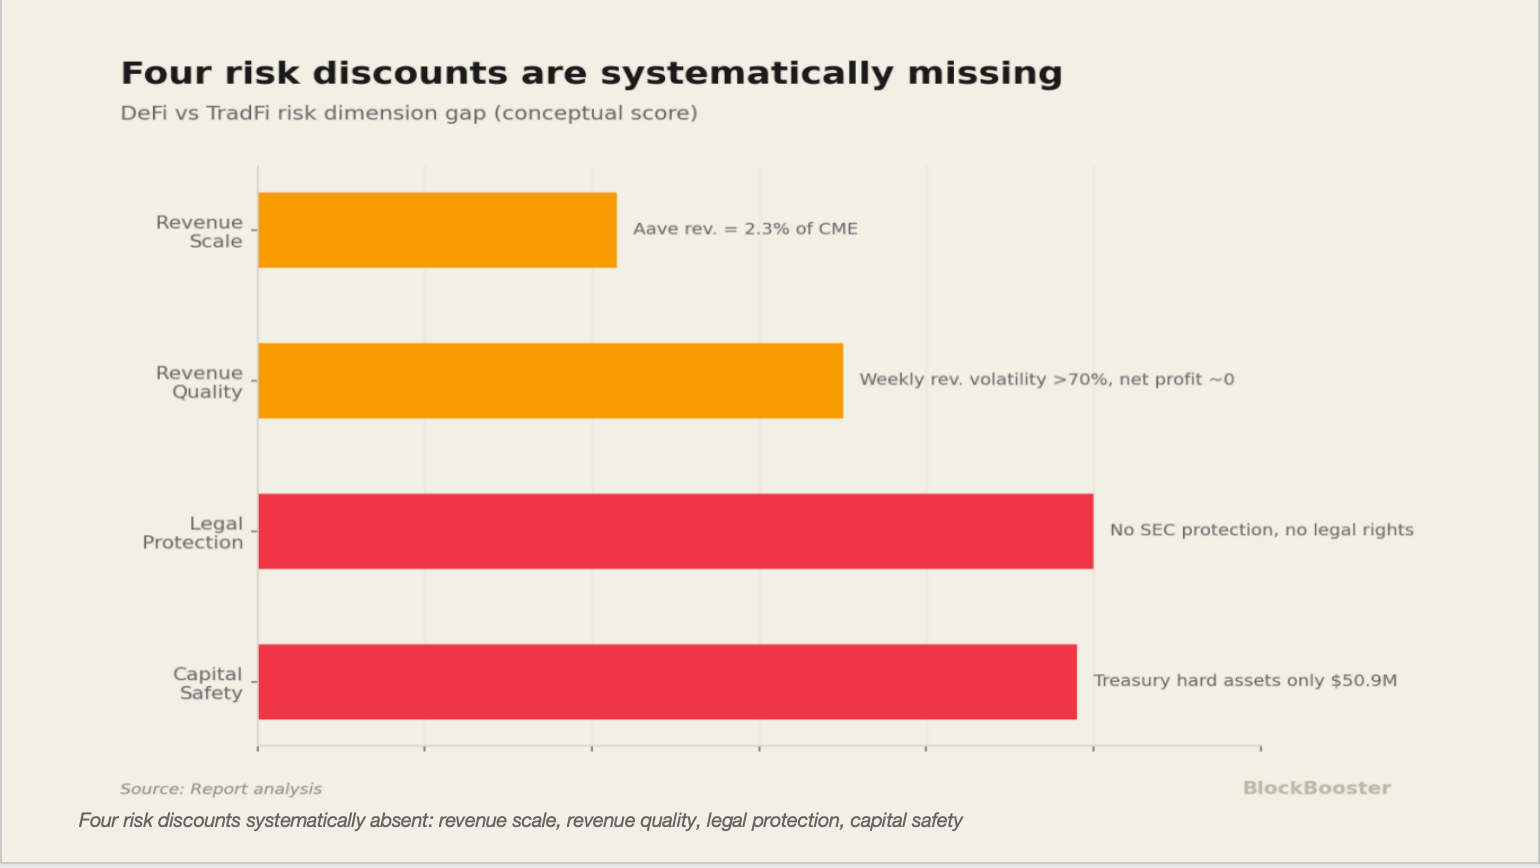
First: the revenue scale gap. Aave’s annual revenue of $140M is just 2.3% of CME’s . In traditional valuation, smaller-revenue companies typically carry higher liquidity and scale risk discounts, corresponding to lower P/S multiples — not equal ones.
Second: the revenue quality gap. CME’s quarterly revenue typically fluctuates within ±15%, while Hyperliquid’s weekly revenue swung 70% within 2025 (from $31.1M down to $9.16M). More critically, Hyperliquid’s 2025 total fees of approximately $908M nearly equaled revenue of $843M — after token incentives, net profit approaches zero. The market uses P/S rather than P/E to value DeFi protocols partly because the concept of “net profit” barely exists on-chain. But that’s precisely the problem: if an asset cannot support a P/E calculation, it shouldn’t be priced at the P/S multiple of a company trading at 27x P/E.
Third: the legal and institutional protection gap. CME shareholders are protected by SEC regulation, with statutory rights to information disclosure, voting, and residual claims on assets. AAVE holders have none of these protections under law. This gap should translate into a substantial valuation discount.
Fourth: the capital safety gap. CME is subject to CCAR stress tests and is prohibited from buybacks when capital ratios fall short. Aave faces no such constraint — as the next section will reveal, its treasury hard assets don’t even cover one year of buyback expenditure.
This pricing is only rational under one extremely optimistic assumption: that DeFi will grow fast enough to close all of these gaps within a few years. If that assumption fails, current valuations are a bubble waiting to be corrected.
3.3 Earnings Yield: A Useful but Fragile Metric
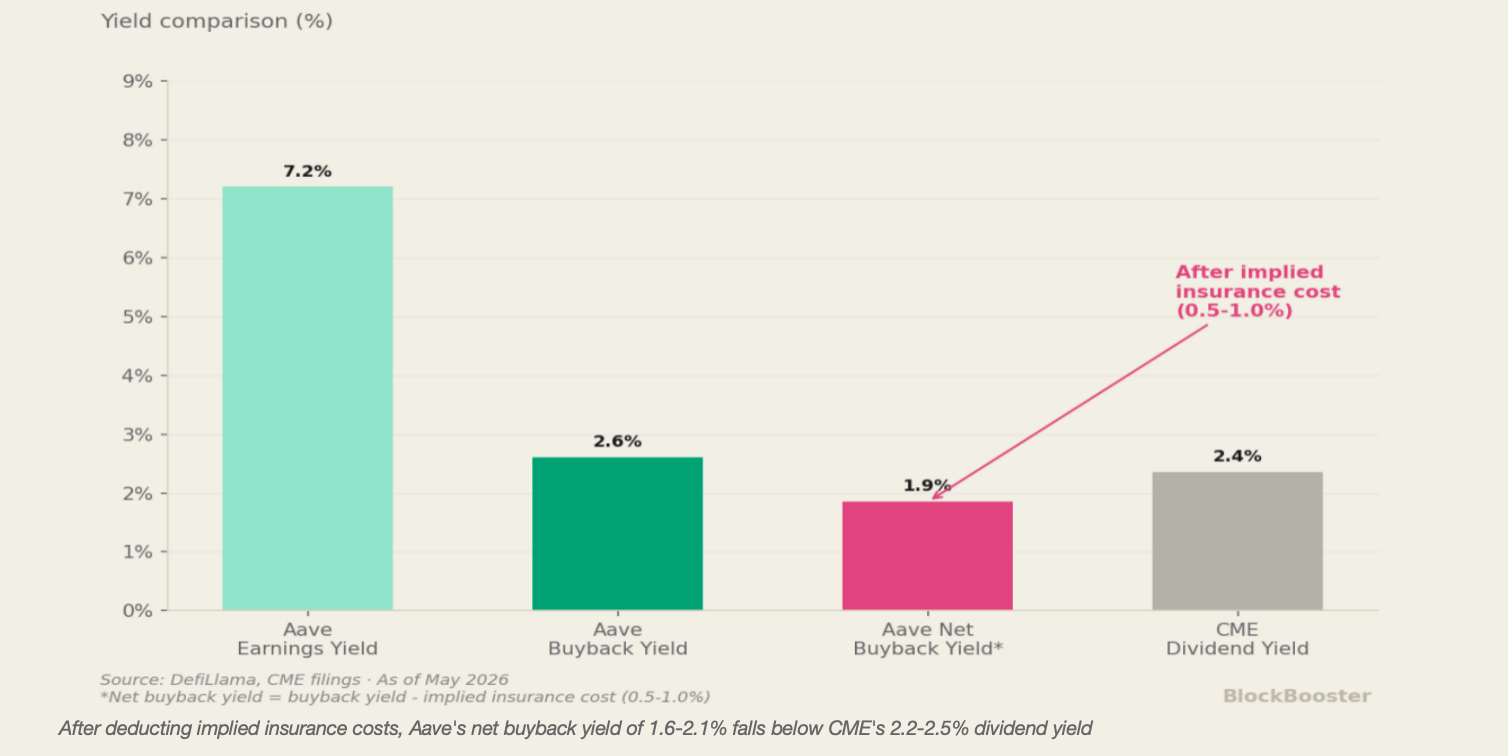
Introducing the “Earnings Yield” (E/P, the inverse of P/E) provides a more intuitive measure of how much buyback support a market cap actually receives.
Using DefiLlama data: Aave’s current P/S of approximately 13.9x, applied to annualized revenue of ~$140M, implies a market cap of roughly . Under this framework:
-
Earnings Yield: $140M / $1.95B ≈ 7.2%
-
Buyback Yield: $50M / $1.95B ≈ 2.6%
For reference, CME’s dividend yield is 2.2–2.5% — placing Aave’s buyback intensity in the same league as large-cap US financial blue chips. But we must introduce an additional cost that CME shareholders never face: implied insurance cost.
AAVE token holders who stake in the safety module face the risk of forced slashing if the protocol incurs bad debt. Referencing DeFi’s historical attack frequency (annualized loss rates of ~1.5–2.0% for leading protocols) and potential slashing magnitude (30–50%), token holders bear an implied annual insurance cost of approximately 0.5–1.0%. This means AAVE’s “net buyback yield after insurance obligations” is actually just 1.6–2.1% — lower than CME’s dividend yield, but with risks an order of magnitude higher.
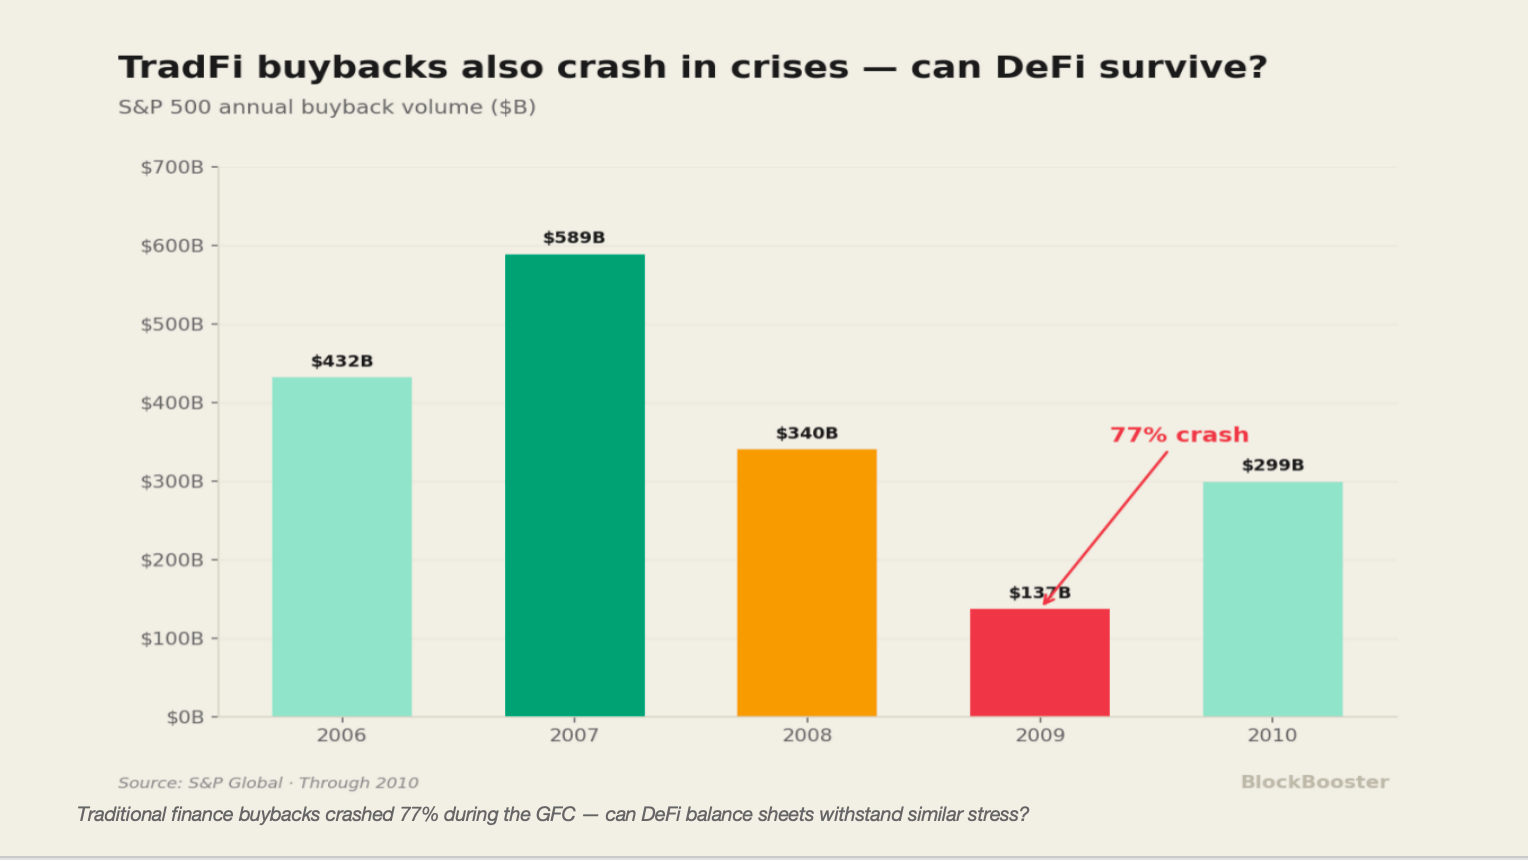
More importantly, this “floor” rests on a hidden premise: the protocol must be able to sustain buybacks continuously. Traditional listed company buybacks also get suspended in crises — during the 2008 financial crisis, S&P 500 total buybacks plunged from a record $589B in 2007 to just $137B in 2009. The question is whether DeFi protocol balance sheets are solid enough to absorb a crisis shock without being forced to halt buybacks.
4. The Hidden Conflict Between Buybacks and Systemic Stability
4.1 The KelpDAO Incident Forces a Buyback Halt
On April 18, 2026 — just six days after “Aave Will Win” passed — KelpDAO’s cross-chain bridge suffered a $292M exploit. The attacker deposited stolen rsETH into Aave V3 as collateral, borrowed approximately $196M in ETH and other assets, and directly created $196M in bad debt on Aave. Aave’s TVL crashed from approximately $26.4B to ~$18B within 48 hours, evaporating . The USDC lending market’s utilization rate hit 99.87% for four consecutive days, effectively preventing depositors from withdrawing.
Just one day later (April 19), Aave DAO was forced to urgently suspend AAVE token buyback operations. TokenLogic stated: “Rather than deploying capital into buybacks, the DAO is putting its strong balance sheet to work supporting protocol liquidity.”
This timeline deserves careful reflection: on April 12, the “most important proposal in history” is passed, committing to $50M in permanent annual buybacks. On April 19, just seven days later, those buybacks are compelled to halt. The 2.6% “floor yield” calculated in Part 3 failed at its very first stress test.
This is not an isolated incident. It exposes a profound, structural identity contradiction in DeFi protocols: DeFi protocols are simultaneously “companies” (needing to generate profit for token holders) and “clearinghouses/central banks” (needing to serve as the ultimate backstop for systemic risk). They are using profits that should serve as a “junior safety cushion” to pump their own token price.
4.2 Quantifying the Contradiction: Does DeFi Need Its Own “Tier 1 Capital Adequacy Ratio”?
Comparing DeFi treasury buybacks against the Basel III framework for traditional banking transforms this contradiction from an intuition into a precise quantitative gap.
Under Basel III, traditional banks must maintain capital equal to at least 8.0% of risk-weighted assets. Under the Federal Reserve’s CCAR stress test framework, if a bank’s Common Equity Tier 1 ratio falls below the threshold, it is directly prohibited from conducting buybacks or paying dividends. In traditional finance, buybacks are a privilege, not a right — you must first demonstrate you are safe enough before being permitted to return profits to shareholders.
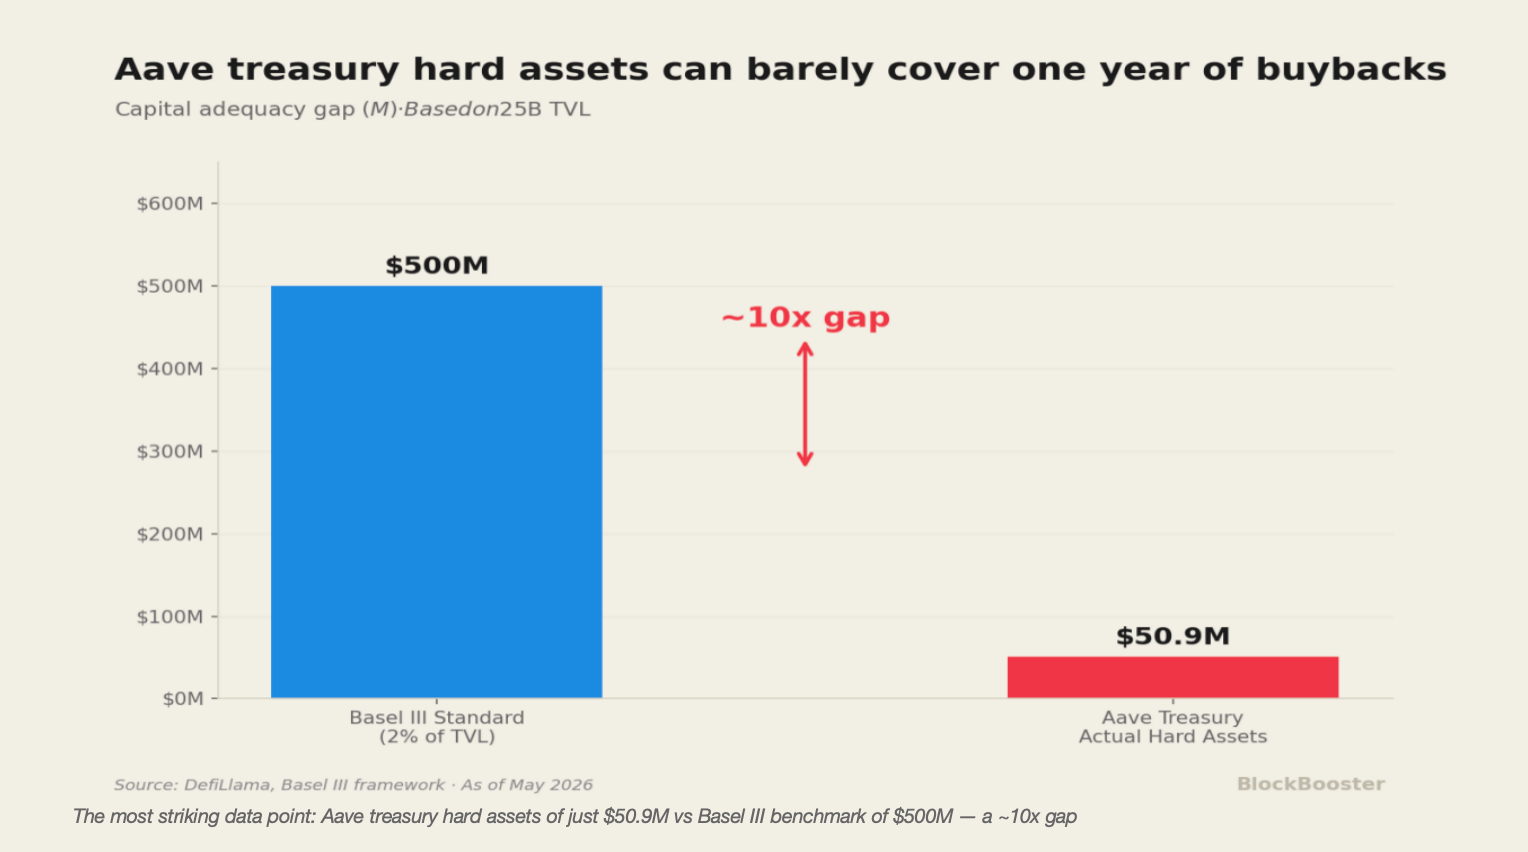
DeFi protocols currently lack any such mandatory constraint. We can set a simplified Basel-style standard for Aave: requiring that non-self-token assets (stablecoins, ETH, and other hard assets) held in treasury must amount to at least 2% of total TVL.
-
Aave’s TVL at the time of the proposal’s passage: ~$25B
-
Required 2% safety buffer: $500M
-
Aave treasury’s actual non-AAVE assets: only approximately $50.9M
This nearly 10x gap is the single most striking data point in this report. To put it bluntly: Aave’s annual $50M buyback expenditure is nearly equal to the total hard asset reserves in its treasury — it is spending its entire “hard currency” reserve on one year of token price support.
4.3 The Reflexivity Trap: Buybacks Manufacturing an Illusion of Safety
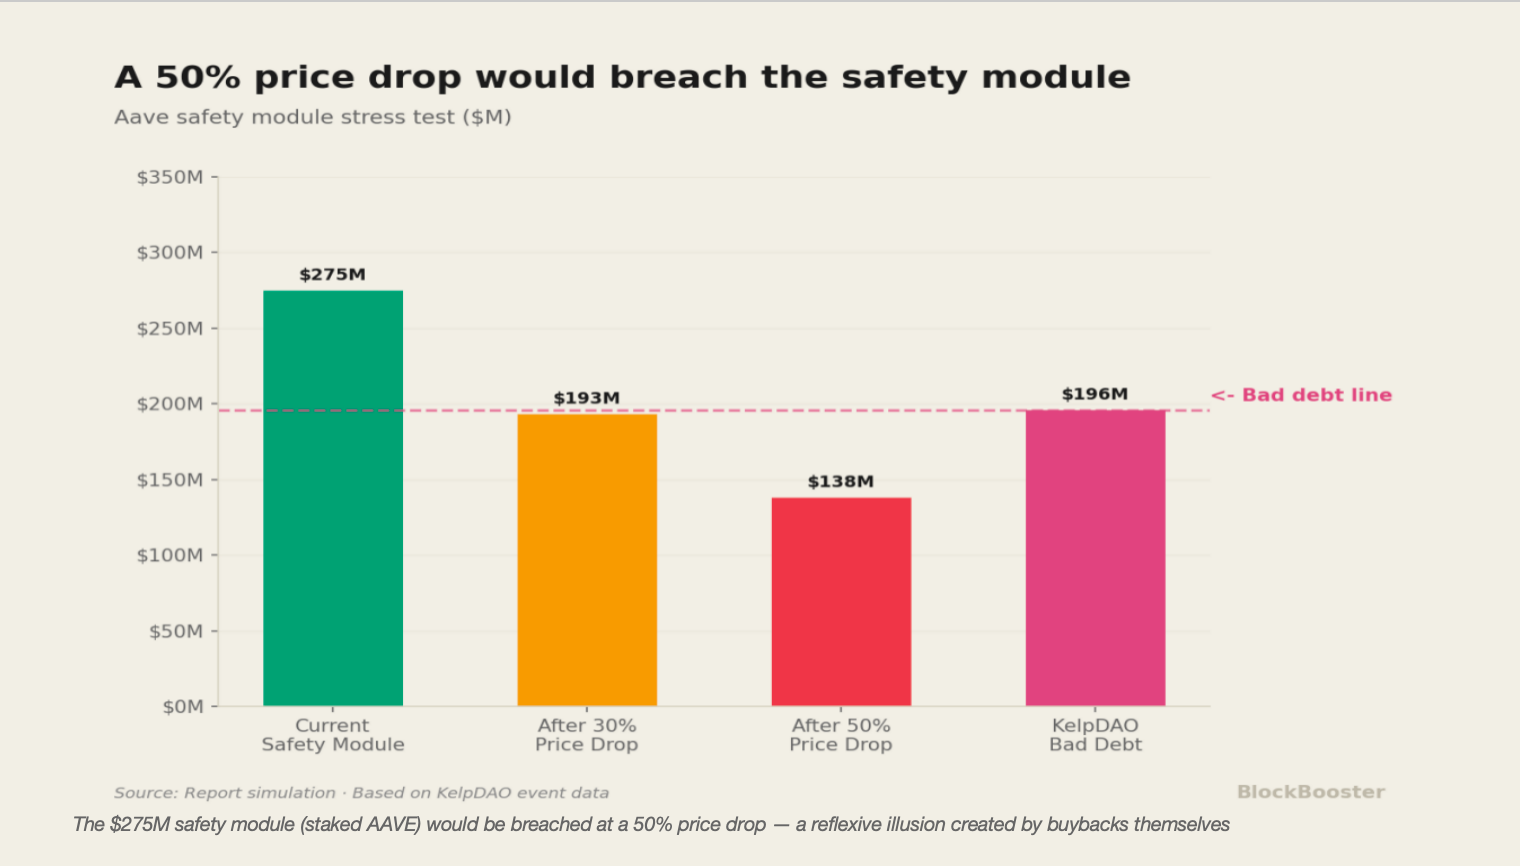
Aave’s safety module (now upgraded to the Umbrella system) does hold approximately $275M in staked AAVE. But a closer examination of this figure reveals a dangerous reflexive cycle:
Buybacks push AAVE price up → USD value of staked AAVE in the safety module rises → The safety module “appears” more adequate → The community gains confidence to approve continued buyback spending → More hard assets flow out of the treasury → The actual hard asset safety cushion continues to shrink.
This is a textbook case of Soros’s “Reflexivity” playing out on-chain. The apparent adequacy of the safety module is partly an illusion manufactured by the buybacks themselves. When a crisis arrives and AAVE’s price falls, this cycle reverses violently:
The KelpDAO incident offered a mild stress test: AAVE’s token price fell only about 2.5% in that event, limiting the safety module’s impairment. But in a more extreme market environment — the kind of cascading liquidation seen in the 2022 Terra/Luna collapse — AAVE’s price could drop 30–50% alongside the bad debt. The $275M in staked AAVE could shrink to $140–190M, while a single event like KelpDAO alone produced ~$196M in bad debt. The safety module would be breached — and the hard assets that had continuously flowed toward buybacks cannot be recovered.
This is precisely why using one’s own governance token as a safety reserve is fundamentally unreliable: it ties the protocol’s security to the token’s market price, and market price is exactly the variable that collapses first in a crisis.
4.4 The Thread From Part 1
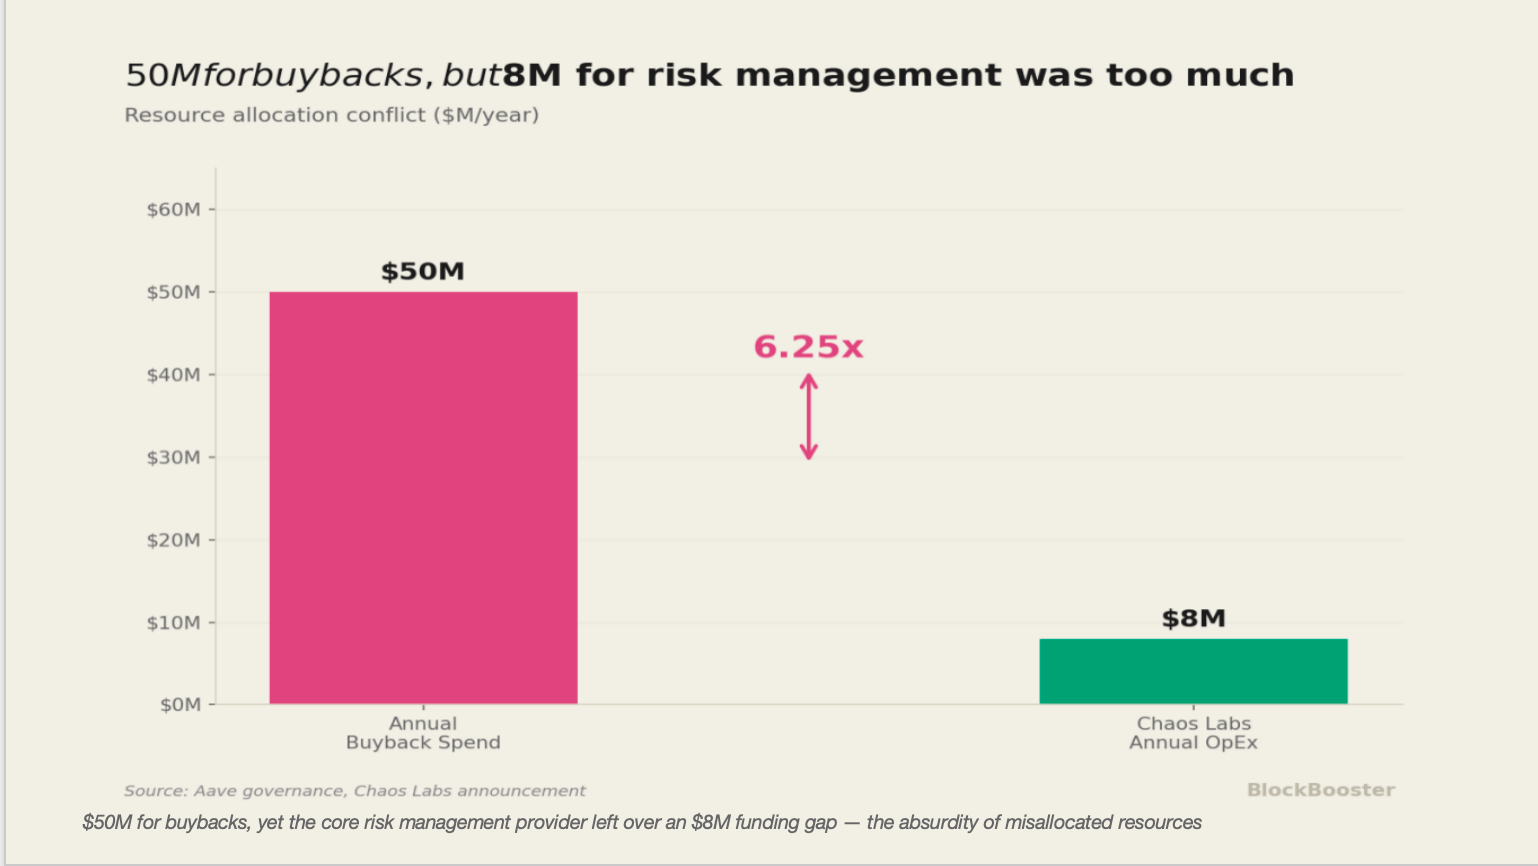
At this moment, revisit the reason Chaos Labs gave when it exited — “existing funding cannot cover its minimum annual operating costs of $8M” — and that number takes on an entirely new weight.
The protocol devotes $50M annually to buying back its token, yet cannot allocate an incremental $8M for its core risk management service provider. Buybacks serve the need for “shareholder value”; risk management serves the need for “clearinghouse safety.” When the two compete for the same finite pool of resources, community voting pressure almost invariably favors the former.
Traditional finance distilled a century of crisis experience into one conclusion: buybacks are a privilege, not a right. You must first pass the capital adequacy threshold before you are permitted to return value to shareholders. DeFi has not yet learned this lesson. Before permitting protocols to launch large-scale buyback or dividend programs, should we not mandate through smart contracts that treasury hard assets must first reach some minimum percentage of TVL? Without resolving this, DeFi’s buyback euphoria is nothing more than mortgaging future resilience for present optics.
——————————————————————
About BlockBooster:
BlockBooster is a next-era alternative asset management firm for the digital age. We leverage blockchain technology to invest in, incubate, and manage the core assets of this new era, from native crypto projects to Real World Assets (RWA). As value co-creators, we are dedicated to unlocking the long-term potential of these assets, capturing exceptional value for our partners and investors in the digital economy.
Disclaimer:
This article/blog is provided for informational purposes only. It represents the views of the author(s) and it does not represent the views of Movemaker or its affiliates. It is not intended to provide (i) investment advice or an investment recommendation; (ii) an offer or solicitation to buy, sell, or hold digital assets, or (iii) financial, accounting, legal, or tax advice. Digital asset holdings, including stablecoins and NFTs, involve a high degree of risk, can fluctuate greatly, and can even become worthless. You should carefully consider whether trading or holding digital assets is suitable for you in light of your financial condition. Please consult your legal/tax/investment professional for questions about your specific circumstances. Information (including market data and statistical information, if any) appearing in this post is for general information purposes only. While all reasonable care has been taken in preparing this data and graphs, no responsibility or liability is accepted for any errors of fact or omission expressed herein.
